SURREY — A series of coloured squiggly lines presented on a neat graph will determine how many undecided voters will cast their ballot.
Becky Lui, 27, is having a hard time determining which abstract band is best for her rather than consulting the values and policies for which the lines represent.
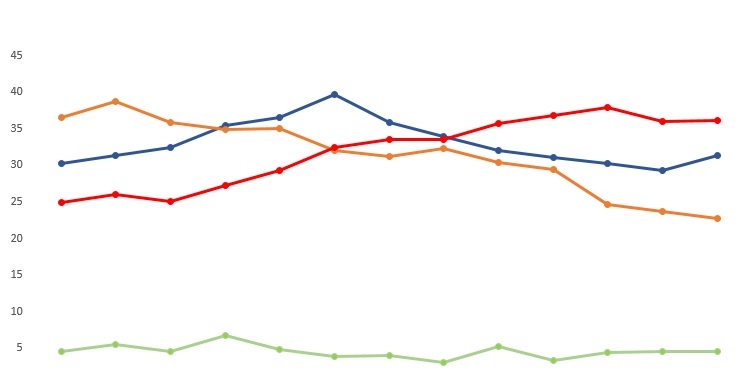
“Wow, look at this red line!” exclaimed Lui pointing at a statistical projection on a Nanos Survey. “I was going to vote for the orange one, but now I’m not so sure. This blue line seems steady, but I’m sick of seeing that colour.”
Another graph with a curvy projection shared by a friend who works with the orange line showed a much closer distance between the three abstract projections. Still, there was some consideration for the one closest to the bottom.
“I feel bad for that green line all the way down there; doesn’t it deserve some attention?” asked a squinting Charles Steinbach, another undecided voter.
According to sources, some swing voters were basing their choice on wind direction, ouija board outcomes or candle wax reading.

